
8 Maintenance KPIs Every SNF Facilities Director Should Track for Survey Confidence

The surveyor walks in on a Tuesday morning, unannounced, and asks for your generator test logs. Not a summary. The actual logs, with load readings, transfer switch documentation, and any deficiencies noted and resolved. You open the binder. The last three monthly tests are there, but the kW load column is blank on two of them. The technician ran the test. He documented the runtime. He just didn't record the load.
That one omission, repeated twice, is a K-tag. Not because the generator failed. Because the documentation failed. And the frustrating part is that nobody in the building knew the gap existed until a stranger with a clipboard found it.
This is the operational reality every SNF maintenance director lives with: the difference between a clean survey and a citation is often not whether the work was done, but whether the right data was captured, at the right time, in the right format. Tracking maintenance KPIs gives you the ability to find those gaps yourself, before the surveyor does. But only if you're tracking the right metrics, in a way that surfaces compliance risk, not just equipment performance.
The eight KPIs below are ordered by their direct impact on survey outcomes. They are not generic facilities management benchmarks. They are the specific measurements that translate daily maintenance activity into survey confidence, and they're built around the documentation patterns that most commonly produce CMS life safety citations in skilled nursing facilities.
1. Inspection Completion Rate by Regulatory Cadence
Inspection completion rate by regulatory cadence is the single most predictive KPI for survey citation risk. It answers one question: are your required inspections happening on the schedule CMS and NFPA standards require, not just when time permits? A high overall completion rate can mask dangerous gaps if the underlying cadence is wrong.
Most SNF maintenance teams track whether inspections were completed. Far fewer track whether they were completed on time relative to the required frequency. The difference matters enormously during a survey. A fire extinguisher inspection completed 47 days after the prior one, when NFPA 10 requires monthly inspection, is a documentation gap even if every extinguisher passed. CMS surveyors look at dates, not just checkboxes.
What to Measure
Break your inspection completion rate into three sub-metrics: inspections completed on time (within the required regulatory window), inspections completed late (past the required interval but before the next due date), and inspections missed entirely. Many teams only track the first and third categories, but the "late" bucket is where survey risk quietly accumulates. A generator that gets its monthly test on day 33 instead of day 30 is technically late under NFPA 110, and a pattern of consistently late tests can draw surveyor scrutiny even when the tests themselves pass.
Segment your completion rate by asset category: fire protection systems, emergency power, medical gas, water management, environmental safety, and egress. A facility that runs at 95% overall completion but 78% on fire protection inspections has a serious problem that the aggregate number hides.
How to Apply This
Set a minimum threshold of 100% on-time completion for any inspection tied to a life safety K-tag. For other regulatory inspections, set your internal threshold at 98% or higher, with an automatic alert when any category drops below 95%. Review your cadence data weekly, not monthly. By the time a monthly report reveals a missed inspection, you may already be outside the acceptable regulatory window.
The goal is not just doing the inspections. It's being able to prove, with timestamped records, that every required inspection happened within the required interval, assigned to a qualified person, with results documented contemporaneously. That level of documentation is what turns a good maintenance program into survey-ready evidence.
2. Documentation Completeness Score per Work Order
A completed work order is not the same as a complete work order. Documentation completeness score measures whether each closed work order contains all the fields a CMS surveyor would expect to see: asset identification, inspection type, technician credentials (or contractor license number), findings recorded, deficiencies noted, corrective action taken or deferred, and the date and time of completion. Missing any of these elements creates a documentation gap that can produce a citation even when the underlying work was done correctly.
This is the KPI that most directly addresses the generator scenario from the opening of this article. The technician ran the test. The runtime was logged. But the kW load reading, which is a specific requirement under NFPA 110 for monthly generator tests, was blank. The work order showed "complete." The documentation score for that work order should have shown "incomplete," and triggered a correction before the binder was closed.
Building Your Scoring Model
Create a required-field checklist for each inspection type based on its specific regulatory requirements. Generator monthly tests have different required data points than fire door self-closing device checks, which have different requirements than eyewash station flushing logs. A single generic work order template cannot serve all of these. Each inspection category needs its own field requirements, and your documentation completeness score should be calculated against those category-specific requirements, not a universal template.
Assign each required field a weight based on its regulatory importance. Fields that correspond directly to K-tag requirements should carry higher weight than administrative fields. A missing technician signature on a generator test log is a more serious gap than a missing asset location code. Your scoring model should reflect that hierarchy so that your dashboard surfaces the most compliance-critical gaps first.
How to Apply This
Set your target at 100% completeness for any inspection tied to a life safety K-tag. For other inspections, a 95% completeness threshold is a reasonable operational floor, with investigation required any time a category drops below that level. Build your review cadence so that incomplete work orders are flagged before they are closed, not after. Retroactive documentation is one of the most common problems surveyors identify, and "correcting" a log after the inspection date creates credibility issues even when the underlying work was legitimate.
Facilities using maintenance dashboard software with field-level validation, where the system prevents a work order from closing without all required fields, consistently outperform those relying on technician discipline alone. The system should enforce completeness, not just report on it after the fact.
3. Deficiency Resolution Time by Severity and Asset Class
Deficiency resolution time measures how long it takes to close a documented finding, from the moment it's recorded to the moment corrective action is verified complete. For CMS purposes, this metric is not just an operational efficiency indicator. It is a compliance record. Surveyors routinely ask not just whether deficiencies were found, but how quickly they were resolved, and whether the resolution was documented with the same rigor as the original finding.
Many SNF maintenance teams are reasonably good at finding deficiencies during inspections. The documentation trail after that point is where things break down. A sprinkler head noted as "impaired" in an inspection log, with no follow-up entry showing when it was repaired, by whom, and what the repair entailed, is an open deficiency in the eyes of a surveyor regardless of whether it was actually fixed the next day.
Stratifying by Severity and Asset Class
Not all deficiencies carry the same regulatory weight, and your resolution time targets should reflect that. Build a tiered structure:
- Immediate life safety deficiencies (impaired suppression systems, blocked egress, non-functional emergency lighting): resolution or interim protective measures documented within 24 hours, per CMS Nursing Home Requirements.
- High-priority regulatory deficiencies (generator load reading omissions, missing fire drill documentation, water temperature exceedances): resolution documented within 72 hours with root cause notation.
- Standard maintenance deficiencies (equipment wear, minor damage, cosmetic issues without safety implications): resolution within 30 days with status updates logged at 7-day intervals.
Track resolution time separately for internally identified deficiencies versus those found by contractors during annual or periodic inspections. Contractor-identified deficiencies from annual fire protection inspections, for example, must be documented and resolved within a timeframe that satisfies your AHJ (Authority Having Jurisdiction) and state survey expectations. The timeline for those findings is often tighter than facilities assume.
How to Apply This
Your maintenance analytics and reporting tools should produce a deficiency aging report that shows every open finding, its severity classification, its age in days, and its assigned owner. This report should be reviewed at a minimum weekly by the maintenance director and flagged to administration when any high-priority deficiency exceeds 72 hours without documented resolution or a formal Plan of Correction entry. The goal is never to have a surveyor find an open deficiency that your own records show has been sitting unresolved for weeks.
4. Life Safety System Test Pass Rate with Trend Tracking
Life safety system test pass rate measures the percentage of required system tests (fire alarm, suppression, emergency power, nurse call, door hardware) that pass on the first attempt, with trend data showing whether that rate is improving, stable, or deteriorating over time. The pass rate alone is a lagging indicator. The trend is the leading indicator that tells you where your next citation risk is developing.
A facility running at an 88% pass rate on fire door self-closing device inspections is already in a difficult position. But a facility running at 95% with a trend showing a 3-point decline over the last six inspection cycles is heading toward a worse one, and without trend tracking, that directional signal is invisible.
Why First-Attempt Pass Rate Matters
Some facilities track pass rates that include re-tests after corrections, which produces an artificially high number. For compliance purposes, what matters is the first-attempt pass rate, because that reflects the condition of the asset at the time of the scheduled inspection. A suppression system component that fails its first test but passes after a same-day repair still generated a deficiency that must be documented, and a pattern of first-attempt failures in the same asset category signals a systemic maintenance problem that a surveyor will eventually notice.
Segment your pass rate by asset category and by wing or zone within your facility. Life safety systems in older wings of a building often show different failure patterns than newer construction. A facility-wide pass rate that looks acceptable can obscure a serious localized problem in a specific unit or corridor.
How to Apply This
Build a six-cycle trend chart for each life safety system category. Review it quarterly. When any category shows a declining trend over three or more consecutive cycles, treat it as a capital planning signal, not just a maintenance scheduling issue. Aging suppression system components, deteriorating door hardware, or recurring generator transfer switch failures don't resolve themselves with more frequent inspections. They require investment decisions, and the trend data gives you the lead time to make that case to administration before a surveyor makes it for you.
This is one of the most powerful applications of maintenance analytics and reporting tools: turning inspection data into capital planning intelligence, not just compliance documentation.
5. Preventive Maintenance Compliance Rate (PM Schedule Adherence)
PM compliance rate measures the percentage of scheduled preventive maintenance tasks completed within their required service window, across all equipment categories covered by your maintenance program. Unlike inspection completion rate, which focuses on regulatory inspection cycles, PM compliance rate covers the broader universe of manufacturer-recommended and facility-policy-driven maintenance tasks that keep equipment functioning reliably between regulatory inspections.
For SNF facilities management, PM compliance matters for two reasons: operational reliability and survey defensibility. A generator that receives its required monthly exercise and quarterly full-load test but misses its annual oil change and filter service per manufacturer specification is not fully maintained. If that generator fails during an emergency, the gap in your PM schedule becomes part of the incident record.
Calculating PM Compliance Correctly
PM compliance rate is calculated as: (PM tasks completed on schedule / total PM tasks scheduled in the period) × 100. The critical variable is "on schedule," which requires defining an acceptable service window for each task type. A daily task completed within 24 hours of its scheduled time is on schedule. A monthly task completed within a 5-day window on either side of the scheduled date is a reasonable threshold. A quarterly task should be completed within 10 days of the scheduled date.
Be precise about what counts as "scheduled." If your CMMS or facilities management software does not have a specific scheduled date for every PM task, you don't have a PM schedule. You have a task list. The distinction matters enormously for compliance tracking, because "we do it monthly" is not the same as "it was scheduled for the 15th and completed on the 14th, as documented in work order #4821."
How to Apply This
Set a minimum PM compliance rate of 95% facility-wide, with 100% required for any equipment category directly tied to life safety or regulatory inspection requirements. When compliance drops below threshold in any category, the first diagnostic question is whether the gap is a scheduling problem (tasks not properly loaded into the system), a staffing problem (insufficient labor to complete the schedule), or a parts and vendor problem (waiting on materials or contractor availability). Each cause has a different corrective action, and your KPI review process should be structured to identify the root cause quickly, not just flag the gap.
Facilities that maintain strong PM compliance consistently show fewer deficiencies during regulatory inspections, not because they're luckier, but because well-maintained equipment fails less often and produces cleaner documentation trails.
6. Documentation Lag Time (Time-to-Log After Task Completion)
Documentation lag time measures the average elapsed time between when a maintenance task or inspection is physically completed and when it is logged in the official record. This metric is one of the most undertracked KPIs in SNF facilities management, and it is one of the most consequential for survey outcomes. CMS guidance on contemporaneous documentation is unambiguous: records should reflect activities as they occur, not as they are remembered hours or days later.
In practice, many SNF maintenance teams complete inspections on rounds and then batch-enter the documentation at the end of the shift or the following morning. This practice creates several problems. First, retroactive logging increases the risk of errors and omissions, because details that were obvious at the time of the inspection fade quickly. Second, a surveyor who reviews your logs and finds that every entry was made at 4:00 PM for inspections that span an entire day will question whether the documentation reflects actual contemporaneous observation. Third, batch documentation patterns mean that if a technician is called off before completing data entry, entire inspection records can be lost.
What Good Looks Like
Best practice for documentation lag time is under 15 minutes from task completion to log entry for any life safety inspection. For routine PM tasks, a lag time of under 2 hours is an acceptable operational standard. Anything beyond that introduces meaningful documentation risk. Facilities using mobile documentation tools or shared facility kiosks consistently achieve shorter lag times than those relying on paper-to-computer transcription, because the logging step happens at the point of work rather than at a separate administrative step.
Track documentation lag time as a median rather than an average, because a few extreme outliers (a log entered three days after the fact) will distort an average without reflecting the typical pattern. The median gives you a more accurate picture of daily operational behavior.
How to Apply This
When documentation lag time exceeds your threshold, the corrective action is almost always a workflow change, not a personnel change. If technicians are documenting late, it's usually because the documentation tool is not accessible at the point of work, the logging process is too cumbersome to complete on the move, or the organizational culture treats documentation as administrative overhead rather than part of the job. Addressing those root causes produces more durable improvement than simply instructing staff to document faster.
Platforms designed for shared-kiosk or mobile completion, where the act of logging is built into the task workflow rather than appended to it, produce the most consistent improvement in documentation lag time across SNF facilities.
7. K-Tag Exposure Index (Open Risk by Citation Category)
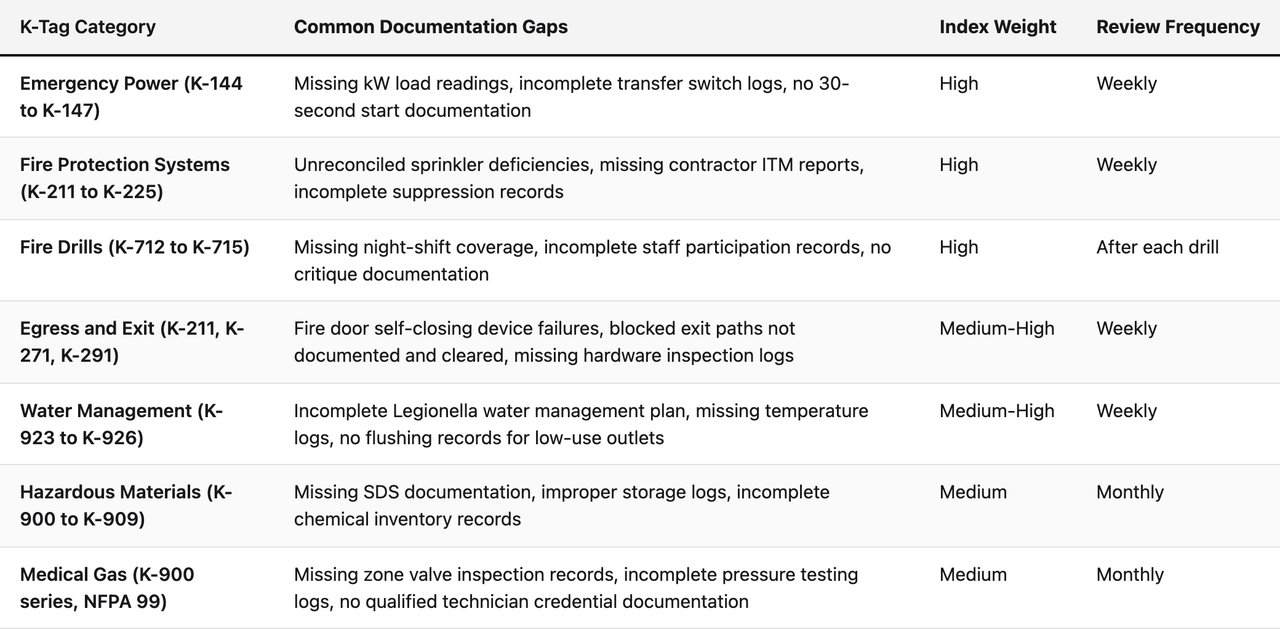
The K-tag exposure index is a composite KPI that quantifies your facility's current documentation exposure across the major CMS life safety citation categories. Unlike the operational metrics above, the K-tag exposure index is specifically designed to mirror how a surveyor would assess your facility, giving you a running estimate of your survey vulnerability before the inspection happens.
CMS life safety citations in skilled nursing facilities are organized around K-tags, each corresponding to a specific provision of NFPA 101 (Life Safety Code) or NFPA 99 (Health Care Facilities Code). The most frequently cited K-tags in SNFs consistently involve fire protection systems, emergency power, egress, and hazardous materials storage. Your K-tag exposure index should reflect the documentation completeness and deficiency status in each of these categories, weighted by the frequency with which CMS surveyors cite them nationally.
Building Your K-Tag Exposure Index
For each major K-tag category, assess three dimensions: inspection currency (are all required inspections current within their regulatory window?), documentation completeness (do all inspection records contain the required data fields?), and open deficiencies (are there any unresolved findings in this category?). Score each dimension on a 0-to-10 scale and aggregate to produce a category score. Weight each category by its relative citation frequency to produce your overall index.
The resulting number is not meant to be a precise regulatory prediction. It is a directional indicator that tells you where your survey risk is concentrated and where to prioritize your documentation review effort. A facility with a strong overall index but a low score in the emergency power category should be spending its next documentation review cycle on generator logs and transfer switch records, not fire extinguisher tags.
How to Apply This
Review your K-tag exposure index at minimum monthly, and build a standing agenda item in your department head meeting to report the index score and any categories that have moved adversely since the last review. For multi-site operators, the index provides a standardized way to compare survey readiness across facilities and prioritize corporate compliance support to the locations with the highest exposure.
The K-tag exposure index is the closest thing available to a pre-survey self-assessment that maps directly to how CMS organizes its citation process. Facilities that build this into their regular SNF facilities management KPIs review process consistently enter surveys better prepared than those relying on periodic binder audits alone.
8. Contractor Documentation Receipt and Reconciliation Rate
Contractor documentation receipt and reconciliation rate measures how consistently your facility receives, reviews, and formally reconciles the inspection and test reports produced by third-party contractors, and how quickly any contractor-identified deficiencies are entered into your internal tracking system. This is the most commonly overlooked KPI in SNF facilities management, and it produces some of the most damaging survey findings.
Many SNF facilities delegate critical life safety inspections to licensed contractors: annual fire alarm system inspection and testing, five-year sprinkler obstruction investigations, generator annual load bank testing, medical gas system verification, backflow preventer testing, and kitchen hood suppression inspection, among others. These contractors produce detailed written reports. Those reports contain findings, deficiencies, and required corrective actions. And in a large percentage of SNF facilities, those reports sit in a file folder or email inbox without ever being formally reconciled against the facility's own maintenance records.
The Reconciliation Gap
When a contractor identifies a deficiency in their report, two things must happen: the finding must be entered into your internal deficiency tracking system, and the resolution must be documented with the same specificity as the original finding. A contractor report that says "sprinkler head in Room 214 showing signs of corrosion, recommend replacement" creates a documented deficiency that must be closed. If your internal records don't show that deficiency was logged, assigned, repaired, and verified, the contractor's report becomes evidence of a known problem that was not addressed, which is a significantly worse survey finding than simply missing an inspection.
Reconciliation also means verifying that contractor reports contain all the required data elements. An annual fire alarm inspection report from a licensed contractor that is missing the technician's license number, or that does not document the results of each initiating device tested, is an incomplete record even though it came from a professional. Your reconciliation process must include a completeness check against the requirements of NFPA 72 for fire alarm systems or the relevant standard for other system types.
Building a Reconciliation Workflow
Create a contractor report receipt checklist for each contractor and inspection type. When a report arrives, the receiving staff member (or the facilities management software, if it supports document intake) checks the report against the required content list before accepting it as complete. Any missing elements are flagged back to the contractor for correction before the report is filed. All contractor-identified deficiencies are entered into the internal tracking system within 24 hours of report receipt, with the contractor report attached as supporting documentation.
Track your reconciliation rate as: (contractor reports fully reconciled within 24 hours / total contractor reports received in the period) × 100. Your target should be 100%. Any gap in this metric represents a period during which your facility had documented deficiencies on paper that were not reflected in your active tracking system, which is precisely the scenario that produces the most damaging survey findings.
How to Apply This
For multi-site operators, contractor documentation management is often the weakest link in the compliance chain precisely because it crosses organizational boundaries. The contractor relationship is often managed by the regional facilities director or a corporate procurement function, while the documentation responsibility sits with the individual facility maintenance director. Without a clear protocol for who receives the report, who reviews it, who enters deficiencies, and who confirms resolution, reports routinely fall through the gaps. Establishing that protocol explicitly, and tracking the reconciliation rate as a formal KPI, is the most direct way to close that gap.
Platforms that support contractor document intake, with AI-assisted review for completeness and automatic deficiency extraction, can dramatically reduce the manual burden of this process while improving the consistency and speed of reconciliation.
How These Eight KPIs Work Together as a Maintenance Dashboard
Tracking any one of these metrics in isolation gives you a partial picture. Tracking all eight together, in a unified maintenance dashboard software view, gives you something more valuable: a real-time compliance posture assessment that tells you not just how your maintenance program is performing, but how it would perform under surveyor scrutiny today.
The relationship between these KPIs is not additive. It's multiplicative. A facility with excellent inspection completion rates but poor documentation completeness is building a record that looks active but is full of holes. A facility with strong documentation completeness but slow deficiency resolution is producing thorough records of problems it's not fixing quickly enough. A facility with good internal metrics but poor contractor reconciliation is unaware of the documented deficiencies sitting in contractor reports it hasn't reviewed. Each KPI closes a different gap, and the gaps compound.
The Pre-Survey Dashboard Review Protocol
Build a standing monthly review protocol that walks through all eight KPIs in sequence, with a specific question for each:
- Are all required inspections current within their regulatory window? (Inspection Completion Rate)
- Do all closed work orders contain the required data fields for their inspection type? (Documentation Completeness Score)
- Are any deficiencies older than their severity-based resolution target? (Deficiency Resolution Time)
- Is the first-attempt pass rate for any life safety system category declining over the last three cycles? (Life Safety System Test Pass Rate)
- Is PM compliance above 95% in every equipment category? (PM Compliance Rate)
- Is documentation lag time within the established threshold for life safety inspections? (Documentation Lag Time)
- Does the K-tag exposure index show any category with elevated risk that requires immediate documentation review? (K-Tag Exposure Index)
- Have all contractor reports received since the last review been fully reconciled, with deficiencies entered and tracked? (Contractor Reconciliation Rate)
This review takes approximately 45 minutes when the underlying data is organized in a dashboard. It takes most of a day when the data is spread across paper binders, spreadsheets, and email inboxes. The operational case for maintenance analytics and reporting tools that consolidate these metrics is not primarily about efficiency. It's about the quality of the review itself: when data is hard to access, reviews get compressed, gaps get missed, and the next surveyor finds what the last review didn't.
Connecting KPIs to Action, Not Just Reporting
The most common failure mode in KPI programs is tracking without acting. A maintenance director who reviews eight metrics monthly and produces a report is doing less than a director who reviews four metrics weekly and triggers specific corrective actions when any metric moves adversely. The value of these KPIs is not in the numbers themselves. It's in the decisions they drive: scheduling an additional documentation review, escalating a stalled deficiency to the administrator, requesting a contractor re-inspection, or making the capital case for aging equipment replacement.
Build each KPI into a decision rule: if this metric falls below this threshold, this specific action is taken within this timeframe. Without the decision rule, the KPI is information. With it, the KPI is a management system.
Frequently Asked Questions
What is the most important maintenance KPI for SNF survey readiness?
Inspection completion rate by regulatory cadence is the highest-priority KPI because it directly determines whether your facility has the required documentation for every CMS-mandated inspection. Without a 100% on-time completion record in life safety categories, no amount of documentation quality improvement can fully compensate for the missing records a surveyor will find.
How is the K-tag exposure index different from a standard compliance audit?
A standard compliance audit is a periodic snapshot, typically conducted quarterly or annually, that assesses your documentation at a point in time. The K-tag exposure index is a continuous, running metric that updates as inspections are completed, deficiencies are opened and closed, and contractor reports are reconciled. It gives you a current-state view of your survey risk rather than a historical one, which means you can act on it before a surveyor arrives rather than after.
What is an acceptable documentation completeness score for SNF life safety inspections?
For any inspection tied to a CMS life safety K-tag, the only acceptable documentation completeness score is 100%. For other regulatory inspections, a 95% threshold is a reasonable operational floor, but any inspection category that consistently runs below 98% should be investigated for root cause and corrected. The specific required fields vary by inspection type based on NFPA standards and CMS interpretive guidelines.
How should SNF maintenance directors handle contractor reports that arrive incomplete?
Do not file or accept an incomplete contractor report as your official record. Contact the contractor immediately, specify the missing elements, and request a corrected report in writing. Document the date the original report was received, the date the correction was requested, and the date the corrected report was received. This documentation trail demonstrates that your facility identified the deficiency, not a surveyor, which is a meaningfully better compliance posture.
What documentation lag time should SNFs target for life safety inspections?
The target documentation lag time for any life safety inspection is under 15 minutes from task completion to log entry. CMS guidance on contemporaneous documentation means that records should reflect activities as they occur. Batch documentation practices, where inspections conducted throughout the day are entered at shift end, create credibility risks during surveys even when the underlying inspections were performed correctly.
How does deficiency resolution time interact with CMS survey outcomes?
Surveyors assess not just whether deficiencies were identified, but how quickly they were resolved and whether the resolution was documented with the same rigor as the original finding. An open deficiency that has been sitting unresolved for 30 days is a significantly worse finding than a deficiency that was identified and resolved within 48 hours with complete documentation. Slow resolution time is an independent citation risk factor, separate from the deficiency itself.
What is PM compliance rate, and how does it differ from inspection completion rate?
PM compliance rate measures adherence to your scheduled preventive maintenance program, which includes manufacturer-recommended service tasks and facility-policy-driven maintenance activities. Inspection completion rate measures adherence to the specific regulatory inspection schedules required by CMS, NFPA, and state regulations. Both are important, but inspection completion rate is the higher-priority metric for survey readiness because regulatory inspections are what surveyors directly review.
Can these KPIs be tracked using a spreadsheet, or is dedicated software required?
All eight of these KPIs can theoretically be tracked in a spreadsheet, but the practical limitation is that spreadsheet-based tracking requires significant manual data entry and is highly vulnerable to the same documentation gaps it's meant to identify. When the maintenance director is the person both doing the work and maintaining the tracking system, gaps in either the work or the documentation are unlikely to surface reliably. Dedicated facilities management software with built-in reporting for these metrics provides both operational efficiency and audit independence, which is why most multi-site SNF operators have moved away from spreadsheet-based compliance tracking.
How often should SNF maintenance directors review these KPIs?
Inspection completion rate, documentation completeness, deficiency resolution time, and contractor reconciliation rate should be reviewed weekly, because gaps in these metrics can develop and compound quickly. Life safety system pass rates and PM compliance should be reviewed monthly, with trend analysis conducted quarterly. The K-tag exposure index should be reviewed monthly and presented at department head meetings. At minimum, all eight KPIs should be assessed together in a structured monthly review.
How do these KPIs apply to multi-site SNF operators versus single-facility operators?
The KPIs themselves are identical, but the application differs. Multi-site operators should standardize these metrics across all facilities using a common scoring methodology, which enables benchmarking between facilities and allows corporate compliance leadership to identify which locations carry the highest survey risk and where to concentrate support resources. Single-facility operators benefit from the same metrics but can apply them with a tighter operational focus, using them as a weekly self-audit tool rather than a portfolio management instrument.
What is the relationship between maintenance KPIs and Five-Star Quality Rating for SNFs?
CMS Five-Star Quality Ratings include a Health Inspections domain that is directly affected by life safety citations. Life safety deficiencies that rise to the level of citations can reduce a facility's health inspection score, which affects overall Five-Star Rating. Maintaining strong maintenance KPIs reduces the documentation gaps that produce citations, which supports health inspection performance. The relationship is not direct (not every documentation gap produces a citation), but the risk pathway is clear and well-documented in CMS Five-Star methodology documentation.
How does SEQURA support these eight KPIs specifically?
SEQURA addresses all eight KPIs through its two-layer architecture. The operational layer manages inspection scheduling, task assignment, and documentation capture in a way that is built around regulatory cadence requirements, which directly supports inspection completion rate, documentation completeness, PM compliance, and documentation lag time. The analytic layer cross-references completed records against regulatory requirements and flags gaps, which supports deficiency resolution tracking, the K-tag exposure index, and contractor reconciliation. The result is a compliance posture dashboard that reflects all eight of these metrics in near real-time, without requiring manual aggregation by the maintenance director.
Key Takeaways
- Inspection completion rate by regulatory cadence is the highest-priority KPI for SNF survey readiness. Track on-time, late, and missed inspections separately, segmented by asset category, not just as an aggregate number.
- Documentation completeness score must be calculated against category-specific field requirements, not a generic template. A completed work order is not a complete work order unless it contains every regulatory-required data element for that inspection type.
- Deficiency resolution time is an independent citation risk factor. Surveyors assess both the deficiency and the speed and quality of the resolution. Build tiered resolution targets by severity and track aging deficiencies weekly.
- First-attempt pass rate with trend tracking is more valuable than a point-in-time pass rate. Declining trends over three or more consecutive cycles are capital planning signals, not just maintenance scheduling problems.
- PM compliance rate and inspection completion rate are different metrics with different thresholds. Both matter, but inspection completion rate carries higher regulatory weight for survey purposes.
- Documentation lag time under 15 minutes for life safety inspections is the operational standard consistent with CMS contemporaneous documentation expectations. Batch documentation practices create credibility risks even when the underlying work was done correctly.
- The K-tag exposure index translates your operational metrics into a survey-risk language, giving you a directional assessment of your compliance posture that maps to how CMS organizes its citation process.
- Contractor documentation reconciliation is the most commonly overlooked KPI and one of the most consequential. Contractor-identified deficiencies that are not entered into your internal tracking system represent documented problems you are officially unaware of, which is a worse finding than a missed inspection.
- All eight KPIs are most valuable when connected to explicit decision rules: specific thresholds that trigger specific actions within specific timeframes. Without those rules, KPI tracking is reporting. With them, it becomes a management system.
- Dedicated maintenance dashboard software designed for SNF compliance consolidates these metrics in ways that make the monthly review meaningful, accurate, and actionable, rather than a manual data-gathering exercise that takes longer than the analysis itself.
About the author
Benjamin Terebelo · Founder
Benjamin is the founder of SEQURA, a compliance platform purpose-built for healthcare facilities. He builds at the intersection of healthcare operations and software, maintaining a focus on bringing modern tooling to systems that the broader industry has largely left behind.
About the author
Benjamin Terebelo · Founder
Benjamin is the founder of SEQURA, a compliance platform purpose-built for healthcare facilities. He builds at the intersection of healthcare operations and software, maintaining a focus on bringing modern tooling to systems that the broader industry has largely left behind.