
Maintenance Analytics Dashboards for SNF Plant Operations: What Metrics Actually Signal Survey Risk

Here is a number worth sitting with: the majority of life safety citations issued during SNF surveys trace back not to equipment that failed, but to documentation that was incomplete, inconsistent, or missing entirely. The boiler ran. The sprinkler was inspected. The fire drill happened. But the record either did not exist, lacked required data fields, or could not be produced on demand. The facility failed not on operations, but on evidence.
This is the central problem with how most SNF plant operations teams think about maintenance analytics dashboards. The instinct is to monitor equipment health: is the generator running, is the HVAC serviced, is the hot water temperature within range? Those are legitimate operational questions. But they are not the questions a CMS surveyor is asking when they walk through the door with a clipboard.
Surveyors audit documentation. They look for K-tag patterns. They cross-reference inspection frequencies against NFPA 101 and NFPA 99 requirements. They ask to see the last three fire drill records, and they notice when the overnight shift is always missing. The gap between what your team is tracking on a maintenance analytics dashboard and what actually signals survey risk is often enormous, and closing that gap is the difference between a clean survey and a citation that lands in your CMS record.
This article builds a practical framework for SNF plant operations leaders to evaluate what their current dashboard is actually measuring, identify the metrics that carry real regulatory weight, and understand which dashboard signals function as early warning indicators of compliance exposure before the next unannounced visit.
Why Most Maintenance Dashboards Miss the Survey Risk Signal Entirely
A conventional maintenance analytics dashboard, whether built in a generic CMMS or assembled in a spreadsheet, tends to organize the world around equipment and tasks: work orders opened, work orders closed, mean time to repair, preventive maintenance completion rates, and asset downtime. These are useful operational metrics. They help plant operations managers allocate labor, budget for parts, and respond to reactive failures. But they are structurally misaligned with how CMS surveys work, and that misalignment creates invisible compliance risk.
The core issue is that standard maintenance metrics treat completion as binary. A task was done or it was not. A work order was closed or it remains open. This binary framing obscures the quality and regulatory validity of what was actually documented. A fire pump inspection can be marked complete while missing the static pressure reading that NFPA 25 requires. A generator test can be logged without the kW load data that CMS K-tag reviewers specifically look for. A sprinkler quarterly inspection can be closed out without a notation of deficiencies found and corrective action status. In each case, the dashboard shows green. The survey outcome is red.
The second structural problem is cadence blindness. Most CMMS platforms track whether a task was completed, not whether it was completed at the right interval relative to regulatory requirements. An annual fire door inspection completed thirteen months after the previous one may appear on a dashboard as completed. To a surveyor reviewing the inspection log, it is overdue, and that gap is a citation vector. The dashboard showed compliance. The record showed a pattern of delayed inspections that looked, to a trained surveyor, like systematic noncompliance.
The third problem is fragmentation. In most SNF plant operations environments, life safety documentation lives in multiple places simultaneously: paper binders, the CMMS, a shared drive, contractor PDF reports, and sometimes a mix of all four. A maintenance analytics dashboard that only reads the CMMS layer has no visibility into whether the contractor who did the annual fire alarm inspection actually submitted a report, whether that report contains the required deficiency notation, or whether the deficiency was resolved within the timeframe NFPA and CMS expect. The dashboard shows a green checkmark. The binder has a gap that a surveyor will find in the first twenty minutes of a life safety tour.
The shift required for SNF facilities management software to actually serve as a survey risk tool is a shift from tracking activity to auditing documentation quality, regulatory alignment, and cross-system completeness. That is a fundamentally different design goal, and it requires a different set of metrics at the center of the dashboard.
The K-Tag Framework: How Surveyors Actually Score Life Safety Risk
Before a plant operations team can build a dashboard that signals survey risk, they need to understand the scoring architecture surveyors use. The K-tag system is the organizing framework for CMS life safety citations in SNFs, and it maps directly to the chapters of NFPA 101 and NFPA 99. Each K-tag represents a specific category of life safety requirement, and citations are issued at the K-tag level, meaning a single documentation gap in the wrong category can generate a citation that appears on your facility's CMS record and triggers follow-up scrutiny.
K-tags are not weighted equally from a survey risk perspective. Some carry immediate jeopardy potential. Others are frequently cited because the documentation requirements are complex and easy to get wrong. The highest-frequency citation categories in the SNF setting consistently cluster around a predictable set of K-tags:
- K321 and related sprinkler system tags: Documentation of quarterly and annual inspections, deficiency identification, and corrective action timelines under NFPA 25.
- K712 and fire drill documentation: Required frequency by shift, documentation of evacuation timing, staff participation, and critique notes.
- K144 and generator testing: Monthly no-load tests, 30-minute loaded tests, annual load bank test records, and fuel level documentation.
- K211 and means of egress: Corridor clearance, exit sign function, emergency lighting testing, and door hardware compliance.
- K211-adjacent fire door tags: Annual fire door inspection records per NFPA 80, corrective action documentation, and qualified inspector credentials.
- K900-series environment of care tags: Hazardous materials, HVAC filter maintenance, and maintenance of patient care equipment connected to life safety systems.
What a well-designed maintenance analytics dashboard should do is map its metrics directly to these K-tag categories, not to generic equipment types. When a plant operations manager opens their dashboard, they should be able to see not just "sprinkler inspection: complete" but "K321 documentation status: deficiency notation present, corrective action status: open, age: 47 days." That is a very different level of signal, and it is the level of signal that actually predicts survey exposure.
The practical implication for SNF plant operations metrics is that your dashboard needs a K-tag layer, either natively or through a compliance-specific integration. Without that layer, the dashboard is tracking operations. With it, the dashboard is tracking survey risk. Those are different instruments with different outputs, and only one of them tells you what you need to know before a surveyor walks through the door.
Documentation Completeness Rate: The Most Undervalued SNF Plant Operations Metric
If a single metric should anchor a survey-risk-oriented maintenance analytics dashboard for SNF plant operations, it is documentation completeness rate, measured not at the task level but at the required-field level within each inspection record. This metric is almost never displayed on standard CMMS dashboards, yet it is the one most directly correlated with citation risk.
Documentation completeness rate answers a specific question: of all the data fields that a given inspection record is required to contain under NFPA standards or CMS K-tag guidance, what percentage are actually populated? A fire pump inspection log that is missing static pressure, residual pressure, and pump RPM readings is not a complete inspection record, even if it was submitted on time by a licensed contractor. A generator test log missing the kW load reading is not a valid monthly test record under the CMS emergency preparedness conditions of participation. The task was done. The documentation is incomplete. The survey risk is real.
Tracking documentation completeness rate requires a system that knows what fields are required for each inspection type, which is why generic CMMS platforms consistently fail this test. A platform built for SNF life safety compliance, like a documentation-intelligence tool purpose-built around NFPA 101 and NFPA 99 requirements, can define required fields at the template level and flag incomplete records automatically. The dashboard then displays not just completion status but completeness status, and those two numbers will frequently diverge in ways that are operationally alarming.
For plant operations managers building their dashboard metrics framework, documentation completeness rate should be tracked at multiple levels:
- By inspection type: Which inspection categories most frequently produce incomplete records? Generator tests, fire pump inspections, and fire door assessments tend to have the highest required-field density and therefore the highest incompleteness rate.
- By technician or contractor: Are incompleteness patterns concentrated with a specific person or vendor? This is a training and accountability signal, not just a compliance signal.
- By K-tag category: Which regulatory areas are most exposed? A pattern of incomplete records in the K712 fire drill documentation category is a direct predictor of a fire drill citation.
- Over time: Is documentation completeness improving or degrading? A declining trend line in any category is an early warning that should trigger immediate review before a survey window opens.
One operational pattern worth understanding: documentation completeness often degrades at the edges of staffing cycles. When a long-tenured maintenance director retires or a facility brings in a temporary plant operations manager, the institutional knowledge of what each inspection record requires tends to leave with that person. A dashboard that tracks completeness rate can catch this degradation within weeks rather than discovering it when a surveyor pulls the binder.
Inspection Cadence Drift: The Metric That Reveals Systemic Compliance Decay
Inspection cadence drift is the gap between when an inspection was required and when it was actually completed, measured as a running average across all inspection types and aggregated at the facility level. It is one of the most powerful survey risk indicators available to SNF plant operations teams, and it is almost never displayed on standard maintenance dashboards.
The reason cadence drift matters so much in the survey context is that CMS surveyors are trained to look at inspection history holistically, not just at whether the most recent inspection was done. When a surveyor pulls an annual fire door inspection log and sees that the previous three annual inspections occurred at 13-month, 14-month, and 13-month intervals, they are looking at a documented pattern of late inspections. Even if the most recent inspection was on time, the historical pattern suggests a facility that manages compliance reactively rather than proactively. That pattern tends to attract closer scrutiny across all documentation categories.
For SNF plant operations metrics, cadence drift should be measured and displayed in a few specific ways:
Average drift by inspection category: Generator monthly tests, quarterly sprinkler inspections, annual fire alarm tests, and semi-annual fire door checks each have specific cadence requirements. Tracking average drift within each category reveals whether a specific inspection type is systematically running late versus whether lateness is broadly distributed.
Maximum drift across all active inspections: This is the single highest-risk metric on a survey-readiness dashboard. The inspection that is most overdue represents the facility's highest-exposure citation vector. If a quarterly sprinkler inspection is running 28 days late, that is the number that should be displayed prominently, not buried in a list of completed tasks.
Drift by responsible party: When cadence drift is concentrated with specific technicians or contractors, it signals accountability gaps that require management intervention. When drift is broadly distributed, it typically indicates scheduling system failure rather than individual performance issues.
A useful benchmark for SNF facilities management software: any inspection cadence drift exceeding seven days for a required regulatory inspection should trigger an automated alert. A drift exceeding fourteen days should generate an escalated notification to the maintenance director and, in multi-site environments, to the regional facilities manager. By the time cadence drift reaches thirty days on a required inspection, the facility has a documentable compliance gap that a surveyor would almost certainly cite.
Open Deficiency Age: The Dashboard Metric Surveyors Most Directly Interrogate
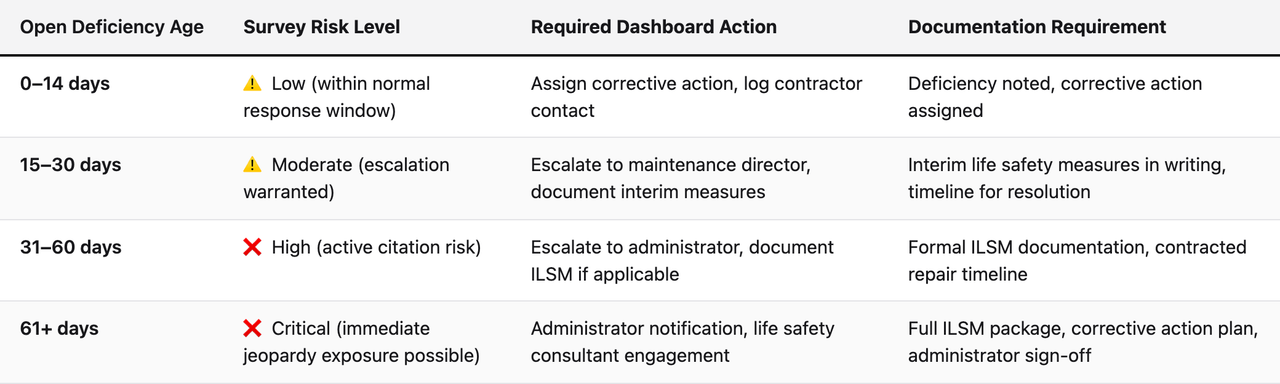
When a licensed contractor performs an annual fire alarm inspection or a quarterly sprinkler test and identifies deficiencies, those deficiencies enter a regulatory clock. NFPA standards and CMS guidance both establish expectations about how quickly deficiencies should be corrected or, when immediate correction is not possible, what interim life safety measures should be documented and in place. Open deficiency age is the metric that tracks how long deficiencies from life safety inspections have been unresolved, and it is one of the most direct predictors of citation risk available to SNF plant operations teams.
The survey mechanism is straightforward: a CMS surveyor reviewing a sprinkler inspection report sees a noted deficiency from a quarterly inspection. They then look for evidence of corrective action. If the deficiency is sixty days old and there is no corrective action documentation, no interim measure notation, and no contractor follow-up scheduled, that is a citation. The deficiency itself may not have been cited originally. The failure to address it within a reasonable timeframe is what generates the citation during the survey.
Open deficiency age should appear on a maintenance analytics dashboard as a sorted list, with the oldest open deficiencies from life safety inspections at the top. For SNF plant operations managers, the operational rule should be simple: no deficiency from a required life safety inspection should remain open without documented corrective action or interim measures for more than thirty days. In practice, facilities that allow open deficiency age to exceed sixty days on any NFPA-covered system are carrying material survey risk that is visible to any surveyor who reads the inspection record.
One frequently overlooked dimension of open deficiency tracking is contractor report integration. Many SNF plant operations teams receive contractor inspection reports as PDF attachments in email, and those reports are filed in a shared drive or printed for the binder. The deficiencies they contain are never entered into the CMMS or the facility's maintenance analytics dashboard. The dashboard shows the inspection as complete. The open deficiency is invisible to any automated tracking system. This is the documentation gap that produces the most avoidable citations in the SNF setting.
Fire Drill Documentation Quality: Why the Overnight Shift Is Your Highest-Risk Signal
Fire drill documentation is among the most frequently cited K-tag categories in the SNF survey environment, and the citation pattern is remarkably consistent across facilities: the overnight shift is underrepresented. CMS requires SNFs to conduct fire drills on each shift, and the documentation must reflect actual staff participation, evacuation timing, and a critique of the drill. When a surveyor reviews twelve months of fire drill records and sees that overnight shift drills are either missing, conducted at inconsistent intervals, or systematically lacking the critique notation, that pattern generates a citation.
For a maintenance analytics dashboard oriented toward survey risk, fire drill documentation quality should be tracked as a composite metric with several components:
Shift coverage completeness: Across the trailing twelve months, has each shift, day, evening, and night, received the required number of drills? A gap in overnight shift coverage is the most common fire drill citation pattern and should trigger an immediate dashboard alert.
Required field population rate: Fire drill records have specific required elements under NFPA 101 and CMS guidance, including the date and time, the number of staff participating, the evacuation time, and a critique or after-action notation. The percentage of fire drill records that contain all required fields is a direct measure of documentation quality and citation risk.
Interval regularity: Fire drills must be conducted at required intervals. A dashboard that tracks the actual interval between consecutive drills on each shift can identify facilities that are conducting drills reactively, bunching them together at the end of a compliance period rather than distributing them throughout the year. Surveyors notice bunching. It suggests that drills are being done for documentation purposes rather than as genuine training exercises, which is a separate concern that can escalate scrutiny.
Staff participation rate: When fire drill records consistently show low staff participation numbers, that is a training and safety concern that can also become a citation concern. A pattern of drills conducted with only one or two staff present when the facility has ten staff on shift raises questions about whether the drill was actually conducted as documented.
The overnight shift problem in SNF fire drill documentation has a practical root cause: overnight drills are harder to conduct because they risk disturbing residents, they require more coordination, and they fall on the shift with the least administrative oversight. The result is that overnight drills are often deferred, abbreviated, or documented less thoroughly than day and evening shift drills. A dashboard that specifically surfaces overnight shift drill coverage as a standalone metric keeps this risk visible to the plant operations manager and the administrator.
Generator Test Documentation: The K144 Metrics That Actually Matter
Generator testing requirements for SNFs are among the most specific and technically detailed documentation obligations in the CMS survey framework. The CMS emergency preparedness final rule and NFPA 110 together establish a layered set of testing and documentation requirements that go well beyond simply running the generator on a schedule. The documentation gaps that produce K144 and related citations are almost always in the details, not the schedule.
For SNF plant operations metrics focused on generator survey risk, the dashboard should track:
kW load percentage during monthly tests: Monthly generator tests must demonstrate that the generator is being exercised under load. The specific load requirement varies by NFPA 110 edition and CMS interpretation, but the documentation must include the actual kW load achieved during the test. A test record that says "generator ran for 30 minutes" without a kW load reading is incomplete documentation and a citation risk. This single missing data field is among the most common generator-related documentation deficiencies found during SNF surveys.
Annual load bank test documentation: When a facility cannot achieve the required load percentage during regular monthly testing, an annual load bank test is required as an alternative. The documentation for this test has specific requirements, and the dashboard should track whether the most recent annual load bank test record contains all required elements: test date, duration, load achieved, and qualified technician certification.
Transfer switch test documentation: Automatic transfer switch testing is a separate documentation requirement from generator testing, and the two are often conflated in facility records. A dashboard that tracks transfer switch test records as a distinct item from generator test records prevents the common error of having generator tests documented while transfer switch tests are missing entirely.
Fuel level documentation frequency: CMS and NFPA both require that fuel levels be documented and that the facility maintain adequate fuel reserves. The frequency of fuel level documentation and the threshold below which an alert should be triggered are specific to the facility's generator capacity and local fuel supply conditions. A dashboard that tracks fuel level documentation as a standalone metric prevents the citation that comes from a surveyor finding a generator with adequate fuel but no documentation showing that fuel levels were monitored.
Building a Survey-Ready Dashboard: The Metrics That Belong at the Top
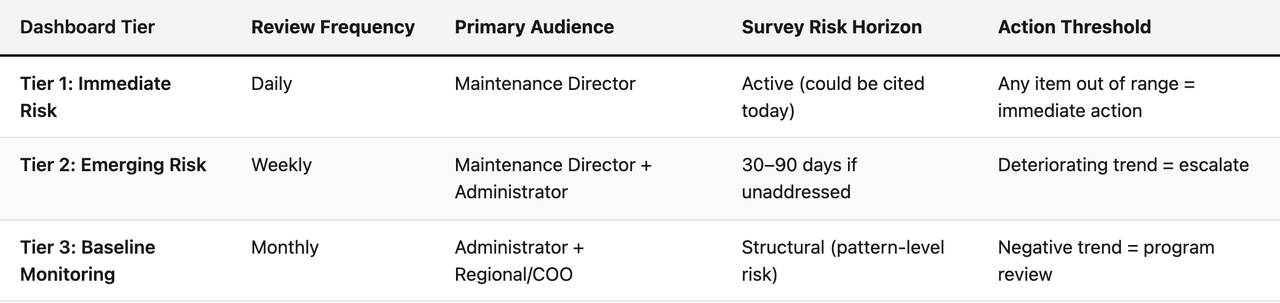
Given the analysis above, here is a practical framework for organizing a maintenance analytics dashboard specifically designed to signal survey risk for SNF plant operations. The framework uses a three-tier structure that distinguishes between immediate risk, emerging risk, and baseline compliance monitoring.
Tier 1: Immediate Risk Indicators (Displayed Prominently, Reviewed Daily)
These metrics represent active citation risk. Any item in Tier 1 that is outside acceptable parameters should be treated as an operational emergency, not a routine maintenance item.
- Open deficiency age over 30 days: Count and list of all life safety inspection deficiencies that have been open for more than thirty days without documented corrective action.
- Overdue regulatory inspections: Count of required inspections that are past their required completion date, sorted by days overdue.
- Incomplete high-risk inspection records: Records for generator tests, fire pump inspections, and sprinkler inspections that are missing required data fields, flagged by field.
- Overnight fire drill coverage gap: Binary indicator showing whether the overnight shift is current on required fire drill frequency.
Tier 2: Emerging Risk Indicators (Reviewed Weekly by Maintenance Director)
These metrics represent developing compliance risk that, if unaddressed, will become Tier 1 items within a standard survey preparation window.
- Inspection cadence drift by category: Average days late across all inspections within each K-tag category, trended over the trailing ninety days.
- Documentation completeness rate by inspection type: Percentage of required fields populated across all completed inspections, broken down by inspection type.
- Contractor report integration status: Count of contractor inspection reports received in the trailing period that have not been logged, cross-referenced, or had their deficiencies entered into the tracking system.
- Fire drill documentation quality score: Composite score reflecting shift coverage completeness, required field population rate, and interval regularity.
Tier 3: Baseline Compliance Monitoring (Reviewed Monthly by Administrator and Maintenance Director)
These metrics provide the long-view picture of regulatory documentation health and are most useful for multi-site operators assessing comparative risk across a portfolio.
- Rolling 12-month K-tag exposure score: A composite metric that aggregates Tier 1 and Tier 2 indicators across all K-tag categories and produces a single facility-level risk score.
- Year-over-year documentation completeness trend: Is the facility's documentation quality improving or degrading relative to the same period in the prior year?
- Corrective action closure rate: Of all deficiencies identified in the trailing twelve months, what percentage were resolved within thirty days?
- Staff training documentation completeness: For life safety training requirements, what percentage of required training records are complete and current?
The Multi-Site Operator Problem: Aggregating Survey Risk Across a Portfolio
For regional facilities managers and COOs at multi-site SNF operators, the challenge is not just building a useful dashboard for a single facility. It is building a portfolio-level view that surfaces the highest-risk facilities before a surveyor does. This is a meaningfully different analytical problem, and the metrics that work at the single-facility level need to be aggregated and normalized in specific ways to be useful at the portfolio level.
The most common failure mode in multi-site SNF facilities management software is the "traffic light dashboard," where each facility is represented as a green, yellow, or red indicator based on an aggregated score. The problem with this approach is that it compresses too much information into too few bits. A facility can be green on overall task completion while carrying a critical Tier 1 risk in a single K-tag category. The portfolio dashboard shows green. The survey exposure is red.
A more useful multi-site dashboard architecture separates two types of signals:
Portfolio-wide pattern analysis: Across all facilities, which K-tag categories are most consistently underperforming? If generator test documentation is incomplete at seven of twelve facilities in a portfolio, that is not a facility-level problem. It is a program-level problem, likely rooted in contractor report integration or technician training. The portfolio dashboard should surface these cross-facility patterns explicitly because they indicate systemic risk that a single facility remediation cannot address.
Facility-level risk ranking: Which facilities in the portfolio carry the highest survey risk right now, based on Tier 1 indicators? A ranked list of facilities by current citation exposure, updated in real time as inspection records are completed and deficiencies are logged, gives regional managers a clear prioritization framework for their oversight visits and intervention resources.
Multi-site operators also face a documentation consistency problem that is worth surfacing in the dashboard: when the same inspection type is documented differently across facilities (different fields, different formats, different levels of detail), it creates audit complexity that slows down any attempt at portfolio-level compliance review. A dashboard that tracks documentation format consistency across facilities, not just completion, helps multi-site operators identify where standardization gaps are introducing compliance risk.
Facilities Management Software Selection: What Survey-Risk Metrics Require from Your Platform
The metrics described in this article are not theoretical. They are operational requirements that a facilities management software platform must be architecturally capable of supporting. When SNF plant operations teams evaluate platforms, the gap between platforms that can produce these metrics and platforms that cannot is significant, and it is not always visible in a demo.
Here are the specific platform capabilities that survey-risk-oriented maintenance analytics require:
Required-field enforcement at the inspection template level: The platform must be able to define which fields are required for a given inspection type and flag records where those fields are not populated. Without this capability, documentation completeness rate cannot be calculated, and incomplete records appear as complete in the dashboard.
Regulatory cadence mapping: The platform must understand the difference between a task that needs to be done "periodically" and a task that must be done within a specific NFPA-defined interval. Generic CMMS platforms typically treat all recurring tasks as equivalent. A survey-risk-oriented platform maps specific inspection types to their regulatory cadence requirements and measures drift against those specific requirements, not against a generic schedule.
Contractor report ingestion and deficiency extraction: This is the capability that most platforms lack and most facilities need. Contractor inspection reports, whether submitted as PDFs or digital documents, contain deficiency information that must be entered into the tracking system if open deficiency age is to be tracked accurately. A platform that can ingest contractor reports, extract deficiency data, and create tracked corrective action items closes the most dangerous gap in SNF life safety documentation.
K-tag categorization of all inspection types: Every inspection type in the system should be tagged to its relevant K-tag category. This allows the dashboard to aggregate documentation quality, cadence drift, and open deficiency age by K-tag, which is how surveyors think about the facility's compliance posture. Without K-tag mapping, the dashboard organizes the world by equipment type or inspection category rather than by regulatory exposure.
Audit trail integrity: Survey-ready documentation requires that records be timestamped, attributed to a specific person, and tamper-evident. A platform that allows records to be edited without logging the original entry and the modification creates documentation that is not defensible in a survey context. This is a platform architecture requirement, not a configuration option.
The NFPA 101 Life Safety Code and NFPA 99 Health Care Facilities Code are the foundational documents that define the inspection requirements SNF platforms must support. Any facilities management software evaluation for an SNF setting should include a specific assessment of how the platform maps its task library to these standards and how it handles the documentation requirements for each.
The Human Factor: Why Dashboard Design Affects Documentation Quality at the Point of Capture
A maintenance analytics dashboard is only as good as the data entering it. In the SNF plant operations environment, data entry happens at the point of inspection, often on a shared kiosk in a maintenance office, a mobile device in a mechanical room, or a back-office computer at the end of a shift. The people entering this data are maintenance technicians and EVS staff who are focused on completing work, not on regulatory documentation requirements. The design of the data entry interface directly determines whether required fields get populated, whether deficiency notations get entered, and whether the inspection record is complete enough to survive survey scrutiny.
This is a frequently overlooked dimension of facilities management software selection for SNF operators. A platform that presents technicians with a long list of free-text fields produces inconsistent, incomplete documentation. A platform that presents structured forms with required fields, dropdown selections for common deficiency types, and embedded guidance notes produces documentation that is complete and consistent across users. The dashboard at the management level reflects the data quality at the entry level, and data quality at the entry level is a function of interface design.
For maintenance directors and administrators evaluating platforms, this means looking carefully at the technician-facing interface, not just the management dashboard. The questions to ask are: Can a technician who has never seen the form before complete it correctly without training? Does the interface prevent submission of records with missing required fields? Does it prompt for deficiency notation when an inspection result indicates a problem? Does it capture a timestamp and user attribution automatically, or does it rely on the technician to enter those manually?
The platforms that produce the best survey outcomes are the ones where documentation quality is built into the workflow rather than enforced through management oversight after the fact. When a technician cannot submit a generator test record without entering the kW load reading, the kW load reading gets entered. When the form accepts a generator test record without that field, the field gets skipped, the record is incomplete, and the dashboard shows a false green.
Frequently Asked Questions
What is a maintenance analytics dashboard in the SNF context?
In the SNF plant operations context, a maintenance analytics dashboard is a real-time reporting interface that aggregates data from inspection records, work orders, contractor reports, and life safety documentation to give maintenance directors and administrators visibility into the facility's compliance posture. Unlike generic CMMS dashboards, a survey-risk-oriented maintenance analytics dashboard is specifically designed to surface documentation gaps and regulatory exposure, not just task completion rates.
Which maintenance KPIs are most relevant to CMS survey risk?
The maintenance KPIs most directly correlated with CMS survey risk are documentation completeness rate, open deficiency age, inspection cadence drift, and fire drill documentation quality by shift. These metrics measure the quality and regulatory validity of inspection records, which is what CMS surveyors examine during life safety tours. Generic KPIs like total work orders closed or mean time to repair have operational value but limited predictive value for survey outcomes.
How do K-tags relate to maintenance dashboard metrics?
K-tags are the CMS citation categories for life safety deficiencies in SNFs, mapped to specific chapters of NFPA 101 and NFPA 99. A survey-risk-oriented maintenance dashboard should organize its metrics by K-tag category so that plant operations managers can see documentation quality, cadence compliance, and open deficiency status within each regulatory exposure area. Without K-tag mapping, dashboard metrics are organized by equipment type rather than by regulatory risk.
What is inspection cadence drift and why does it matter?
Inspection cadence drift is the average number of days that a required inspection is completed after its regulatory due date. It matters because CMS surveyors review inspection history holistically, not just the most recent inspection. A pattern of late inspections across multiple inspection cycles suggests systematic noncompliance even when individual inspections are eventually completed. Cadence drift is one of the most reliable early warning metrics for survey risk.
Why is overnight fire drill documentation such a frequent citation source?
Overnight fire drills are logistically more difficult to conduct than day or evening drills because they risk disturbing residents and require coordination with reduced staffing. The result is that overnight drills are often deferred, abbreviated, or documented less thoroughly. CMS requires drills on each shift, and surveyors are trained to look for overnight coverage gaps because they are so common. A dashboard that tracks overnight shift fire drill coverage as a standalone metric keeps this risk visible before a survey.
What generator documentation fields are most commonly missing during SNF surveys?
The most commonly missing generator documentation fields during SNF surveys are the kW load reading during monthly tests, the transfer switch test record (often conflated with the generator test and omitted as a separate item), and the annual load bank test documentation when the facility cannot achieve required load percentages during monthly testing. A maintenance analytics dashboard should track these specific fields as required items within generator test records.
How should a multi-site SNF operator structure their portfolio-level dashboard?
A multi-site SNF operator's portfolio dashboard should separate two signal types: a facility-level risk ranking based on current Tier 1 indicators (immediate citation risk), and a portfolio-wide pattern analysis that identifies K-tag categories that are consistently underperforming across multiple facilities. The traffic-light summary dashboard is too compressed to be useful for compliance management. Facility-level and cross-facility pattern views together give regional managers the information they need for prioritization and program intervention.
What should SNF plant operations teams look for when selecting facilities management software?
The platform capabilities most critical for SNF survey risk management are required-field enforcement at the inspection template level, regulatory cadence mapping tied to NFPA standards, contractor report ingestion with deficiency extraction, K-tag categorization of all inspection types, and tamper-evident audit trail integrity. Platforms that lack these capabilities may support operational maintenance management but cannot produce the survey-risk metrics that SNF plant operations teams need.
Can a standard CMMS produce the metrics described in this article?
Most standard CMMS platforms cannot natively produce documentation completeness rate, K-tag categorized deficiency tracking, or regulatory cadence drift metrics because they are designed around equipment and work order management rather than regulatory documentation quality. Some CMMS platforms can be configured to approximate these metrics, but the configuration effort is substantial and the results are typically incomplete. Purpose-built SNF compliance platforms are architecturally designed around these specific metrics.
How often should SNF maintenance directors review their survey risk dashboard?
Tier 1 immediate risk indicators should be reviewed daily by the maintenance director, since any item in that tier represents active citation risk that a surveyor could identify on an unannounced visit at any time. Tier 2 emerging risk indicators should be reviewed weekly in a standing review with the administrator. Tier 3 baseline compliance metrics should be reviewed monthly at the leadership level and, for multi-site operators, at the regional and COO level as part of portfolio compliance oversight.
What is the relationship between documentation completeness and survey outcomes?
Documentation completeness is among the strongest predictors of survey outcomes in the SNF life safety context because CMS surveyors work from documentation, not observation. A surveyor cannot watch a generator test that happened three weeks ago. They can only read the record. When that record is missing required fields, the documentation does not meet the regulatory standard regardless of whether the physical test was conducted correctly. Tracking documentation completeness rate gives plant operations teams a leading indicator of survey risk rather than a lagging indicator after a citation has been issued.
How does SEQURA approach the metrics described in this article?
SEQURA is built specifically around the documentation quality and regulatory alignment metrics described in this article. The platform's task template library is built around NFPA 101 and NFPA 99 requirements with required fields enforced at the template level. Its AI review layer reads completed inspection records and surfaces documentation gaps, cross-referencing records against K-tag category requirements. The result is a maintenance analytics dashboard that is oriented toward survey risk rather than operational task completion, giving SNF plant operations teams the visibility they need to close documentation gaps before a surveyor finds them.
Key Takeaways
- Task completion is not documentation compliance. A maintenance analytics dashboard that shows completed inspections without measuring the quality and completeness of those inspection records is providing a false picture of survey readiness.
- Documentation completeness rate is the single most important survey risk metric for SNF plant operations, and it is almost never displayed on standard CMMS dashboards.
- Inspection cadence drift reveals systemic compliance decay before it becomes a citation pattern, and it should be tracked as a running average across all K-tag categories.
- Open deficiency age is directly interrogated by surveyors. Any life safety inspection deficiency open for more than thirty days without documented corrective action or interim measures is an active citation risk.
- Overnight fire drill coverage is the highest-frequency fire drill citation pattern and should be tracked as a standalone metric, not buried in overall fire drill completion rates.
- Generator test documentation requires specific data fields (kW load, transfer switch test, load bank test records) that must be tracked as distinct required items, not just as a generic "generator test completed" indicator.
- A three-tier dashboard structure (immediate risk reviewed daily, emerging risk reviewed weekly, baseline monitoring reviewed monthly) aligns metric review cadence with the urgency of the compliance signal.
- Multi-site operators need both facility-level risk ranking and portfolio-wide pattern analysis to distinguish individual facility problems from systemic program failures that require organizational-level intervention.
- Platform architecture determines dashboard capability. Required-field enforcement, regulatory cadence mapping, contractor report integration, and K-tag categorization are architectural requirements that generic CMMS platforms typically cannot meet.
- Data entry interface design directly affects documentation quality. Platforms that prevent submission of incomplete records produce better documentation than platforms that rely on management oversight to catch gaps after the fact.
What Survey-Ready Plant Operations Actually Looks Like
Survey readiness in the SNF setting is not a state a facility reaches once and maintains passively. It is an active operational posture that requires continuous visibility into documentation quality, regulatory cadence compliance, and open deficiency status across every K-tag category. The maintenance analytics dashboard is the instrument that makes that posture sustainable for a maintenance director managing hundreds of recurring inspection requirements with a small team.
The facilities that consistently perform well on CMS life safety surveys are not necessarily the ones with the newest equipment or the largest maintenance budgets. They are the ones where the maintenance director can open a dashboard on any morning and know, within minutes, exactly where their documentation gaps are, which deficiencies are aging toward citation risk, and whether their overnight fire drill coverage is current. That level of visibility is not possible with a paper binder. It is not reliably possible with a generic CMMS. It requires a platform that is designed from the ground up around the specific documentation requirements that CMS surveyors use when they walk through the door.
The metrics in this article are not aspirational. They are the specific signals that distinguish a facility that will receive a clean life safety survey from a facility that will spend the next quarter responding to citations and implementing corrective action plans. Getting those metrics onto the right dashboard, reviewed at the right frequency, by the right people, is the operational discipline that separates reactive compliance from genuine survey confidence.
For SNF plant operations teams ready to move beyond task completion tracking toward documentation intelligence, the starting point is a straightforward audit: open your current maintenance dashboard and ask how many of the metrics described in this article are visible. The gap between that number and all of them is your current survey risk exposure, measured in the currency that actually matters.
About the author
Benjamin Terebelo · Founder
Benjamin is the founder of SEQURA, a compliance platform purpose-built for healthcare facilities. He builds at the intersection of healthcare operations and software, maintaining a focus on bringing modern tooling to systems that the broader industry has largely left behind.
About the author
Benjamin Terebelo · Founder
Benjamin is the founder of SEQURA, a compliance platform purpose-built for healthcare facilities. He builds at the intersection of healthcare operations and software, maintaining a focus on bringing modern tooling to systems that the broader industry has largely left behind.